The aim of this tutorial is to provide people working in the biosciences with little to no background in programming an accessible and short tutorial on MATLAB basics for common bioscience workflows. It was developed for some courses here at the EMBL and includes exercises …
Sven Mesecke's blog
-
MATLAB in the Biosciences - a Tutorial
Fr 11 Oktober 2013 -
MATLAB in the Biosciences - Solutions
Do 10 Oktober 2013Exercise 1
% there are several ways for creating these arrays
% 1 - squared brackets
A = [1 3 5; 3 6 3; 9 8 5]
% 2 - functions for array creation
A = rand(3)
A = magic(3)

b = [3; 4: 8] % 3 x 1 - column vector!

A * b(1)
A …
-
Julia for MATLAB users III
Do 19 September 2013Previous articles explored julia and its plotting facilities in the Winston package. The workflow used there, (i) data import, (ii) plotting and (iii) graphics export, will be used in this article as well, however, this time using Dataframes and Gadfly in julia and dataset arrays in MATLAB.
Dataset arrays are …
-
Julia for MATLAB users II
So 25 August 2013In the last posts I installed julia, some graphics packages and some dependencies on a Mac and compared one way of plotting in julia - using Winston and plotting several datasets into one plot - with the typical approach in MATLAB. This post will show how to plot each individual dataset into …
-
Julia for MATLAB users I
Do 22 August 2013A number of excellent free open-source alternatives to MATLAB have arrived in the last couple of years that have managed to bite away parts of MATLAB's market share. Most notable are R, which is now the dominant language for statistical computing and bioinformatics and Python (with numpy, scipy etc.) which …
-
Creating “real” subplots in SimBiology using the Plot Type Library
Mi 27 Februar 2013The SimBiology Desktop offers a number of different plot types that can be chosen in a task window. The default plot type in a simulation task, for example, is the
Timeplot, which plots states against the simulation time: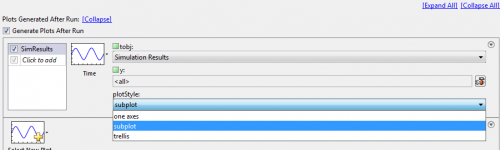
Three items need to be configured for this plot type:
tobj …
-
How to use Global Optimization Toolbox algorithms for SimBiology parameter estimation – in parallel (part II)
Mo 18 Februar 2013In the first part I presented a workflow to export a SimBiology model as well as data to the workspace from the SimBiology Desktop, speed up its simulation and prepare it for parallel computation. Here I will set up the actual optimization problem.
The Optimization solvers usually only accept a … -
How to use Global Optimization Toolbox algorithms for SimBiology parameter estimation – in parallel (part I)
Do 07 Februar 2013Under some circumstances the parameter estimation tasks built into SimBiology® (
sbioparamestimandsbionlinfit) and the SimBiology Desktop (sbionlinfit) are not robust enough for the given data, the model or the initial parameter values.If the objective function has many local minima - which is nearly always the case for complex systems …